Introduction
Due to the recent COVID-19 outbreak, Emporium A, also known as Company A, decided to transition to the E-Commerce Platform, OList, to diversify their retail business and extend online services to adapt to the Digital Age. Company A's Data Science Team was given a set of data from OList. They want the team to interpret the data and transform it into insight which can offer ways to maintain or improve their online company reputation. Online brand management and customer sentiment is highly critical to E-Commerce platforms, which are highly competitive and where customers are likeliest to purchase from established sites due to the nature of E-Commerce (payments made online, risk of fraud and counterfeits, possible delivery faults, etc.)
Data Preparation
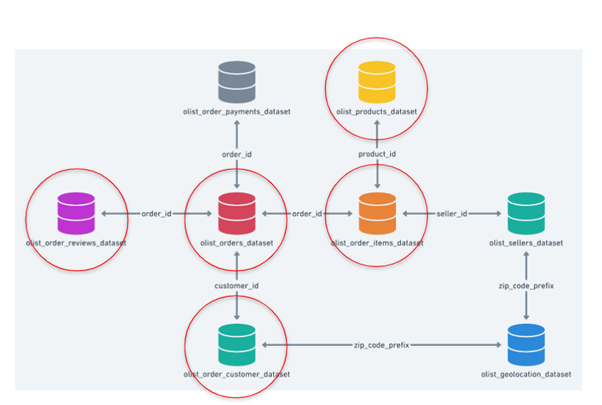
This is our dataset. We have merged these 5 datasets into 1 as we are looking for product order transactions and its review from the customers.
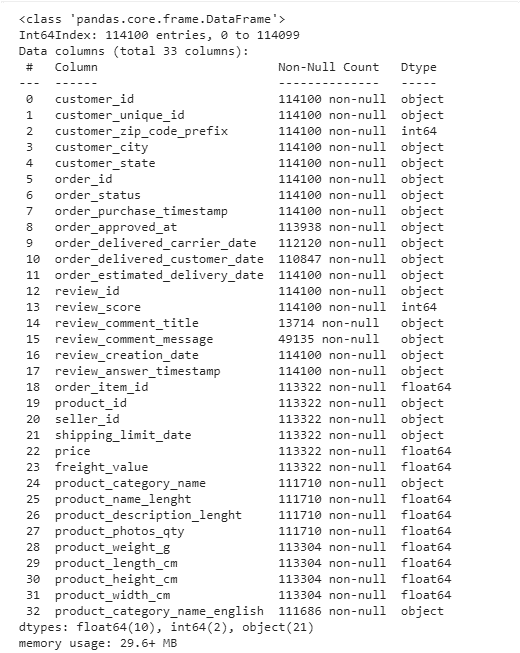
Converting all datetime columns into datetime type

Correcting misspelt words, replace Brazillian Category Name to English followed by translating all the missing translation

Converting Review Score into Categorical as Review Score is not a Continuous Variable

Extracting out desired columns from the main database that helps to form our Hypothesis Columns

Removing any non-existing data or orders that are not delivered

Creating New Predictors out of the subset to match our Hypothesis Columns Description

Removing Redundant Columns

Final DB


Please refer to the .ipynb file for a better view of the DataFrame
Exploratory Data Analysis
Firstly, to help us better understand our 9 predictor variables and our response variable we looked at the Summary Statistics and plotted out Statistical Visualizations for each individual variable
Summary Statistics of Numeric Variables in Review Score DB
.png)
Statistical Visualizations (Boxplot, Histogram & Violin Plot)
.png)
Summary Statistics of Categorical/Discrete Variables in Review Score DB
.png)
.png)
.png)
Statistical Visualizations (Categorical Plot)
.png)
.png)
.png)
Relationship with Review Score
Next, we looked at the relationship of each predictor with our response variable Review Score. We used boxplots and strip plots for numeric predictors and heat maps for categorical/discrete predictors.
.png)
.png)
.png)
.png)
There was no distinct separation of the boxplots of the different Review Score levels. However, there was an indication that some of our predictors such as Actual Delivery Days did affect Review Score.
Creation of Review Type
We found Review Score had too many levels (5 levels) resulting in difficulty predicting accurately. To resolve this, we created a new response variable Review Type which grouped the Review Scores into either negative (1-2) or positive (3-5).

.png)
.png)
Relationship with Review Type
After creation of Review Type, we re-plotted each predictor against it using boxplots, strip plots and heat maps to observe their relationship.
.png)
.png)
.png)
.png)
Through our Exploratory Data Analysis, we have identified the following variables to have some form of impact on the review score:
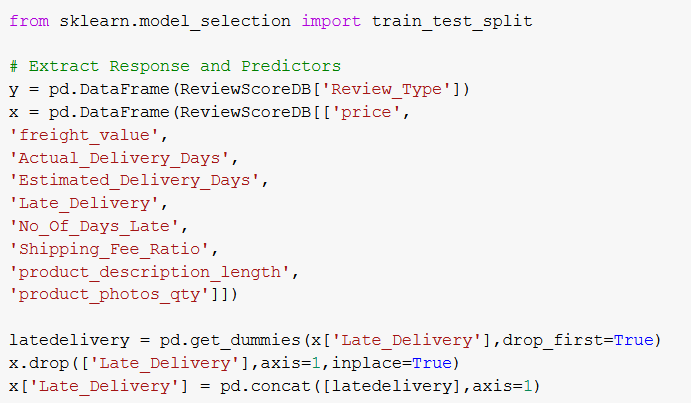
As Late_Delivery is a Categorical Variable with True/False values, it might not fit well into the Machine Learning models and as such we will be replacing the True/False entries with 1/0 values.

Splitting our data into 80/20 train/test, we are now ready to proceed with the Machine Learning part of our project.

Machine Learning
Classification Tree
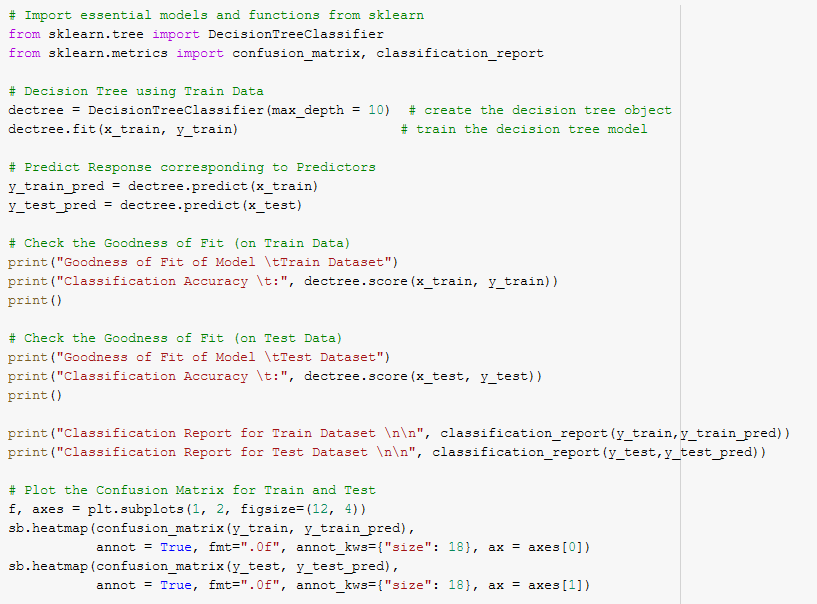
We start off our preliminary machine learning with a simple classification tree to get a feel of the overall performance of our model and find out if there is any relationship between the predictors and customer sentiment (Review Type). Do note that we are weighing nine variables against Review_Type, and overfitting may occur due to the number of predictors at this point. Furthermore, many of the predictors are derived from one another (e.g. Freight Value and Shipping Fee Ratio).
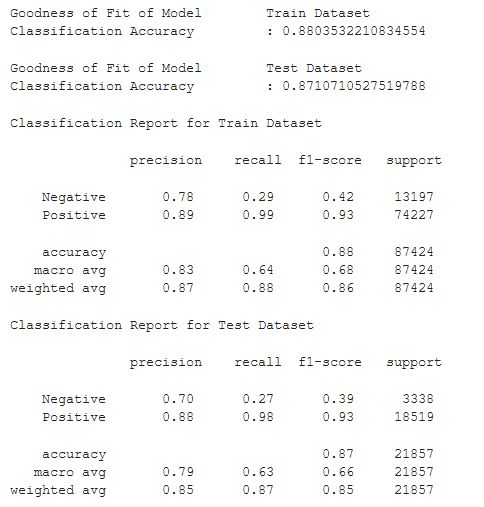
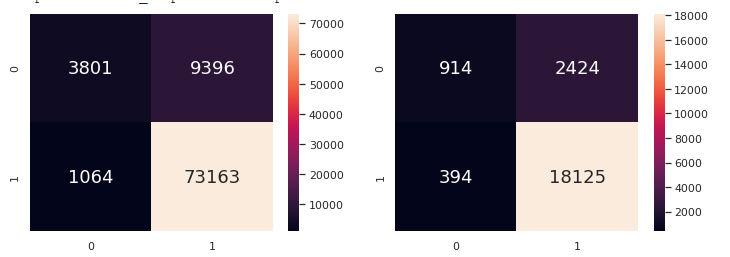
The results look promising, and there appears to be some form of connection between the predictors and the prediction. We still do not know which predictors are more significant yet.
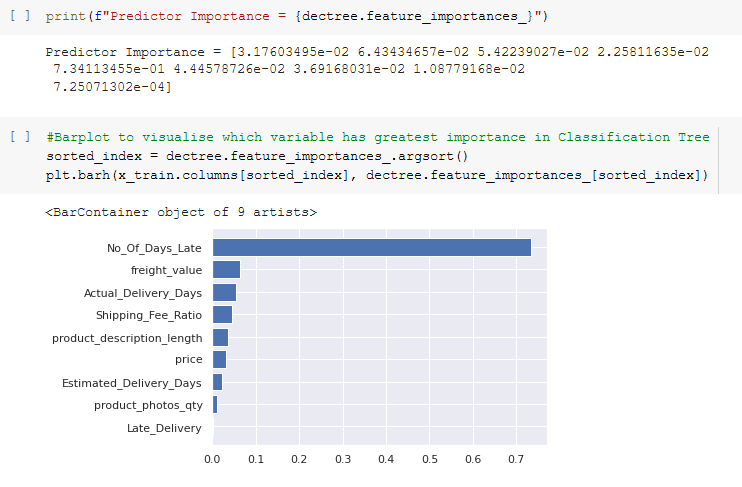
Gleaning deeper into the feature importances, it appears that number of days late was the most important. However, we note that the variable Late Delivery was not used at all. Perhaps, a Random Forest model would be better. Let us proceed.
Random Forest
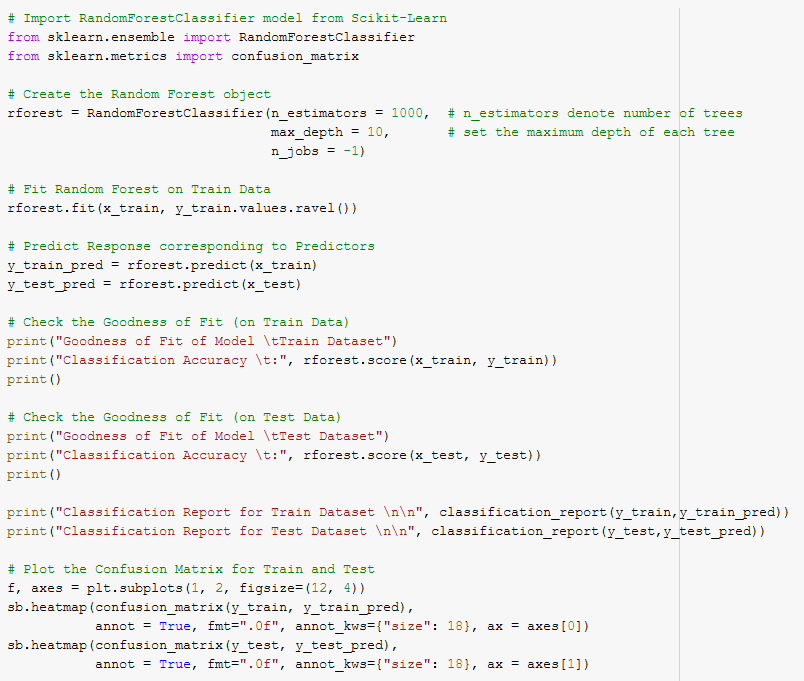
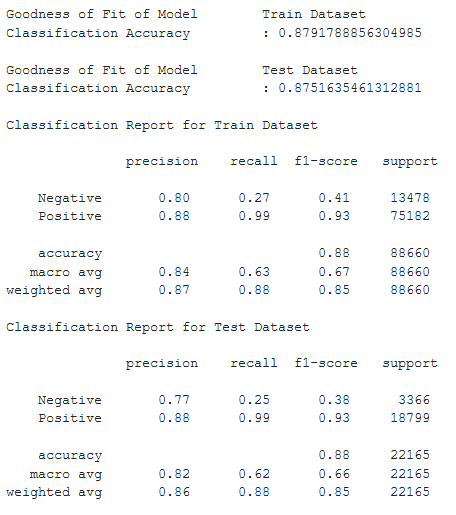
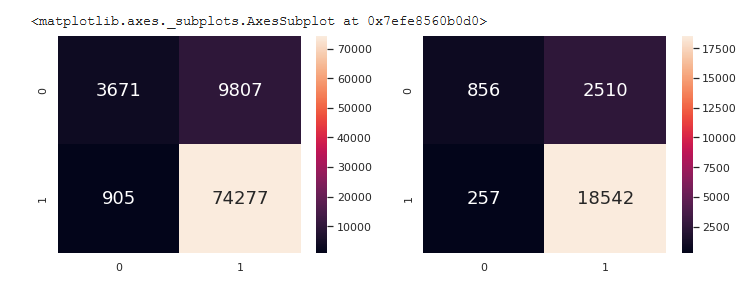
There appears to be similarities to the performance metrics to the model, but very slightly. At this point, we are convinced the model can work and it is time for us to find out which predictors have the most impact on the overall prediction of Review Type.
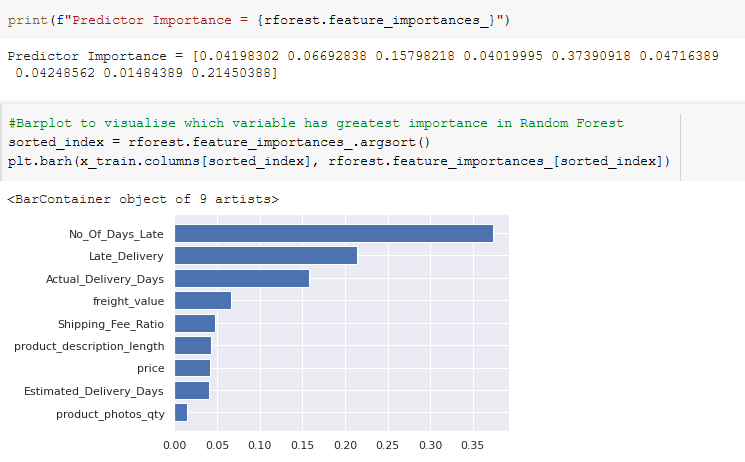
It would appear that the most significant predictors are Number of Days Late, Actual Delivery Days, Late Delivery and Freight Value. As such, we will be mainly focusing on these three for our machine learning.
Modification of Data Predictors & Redo of Random Forest
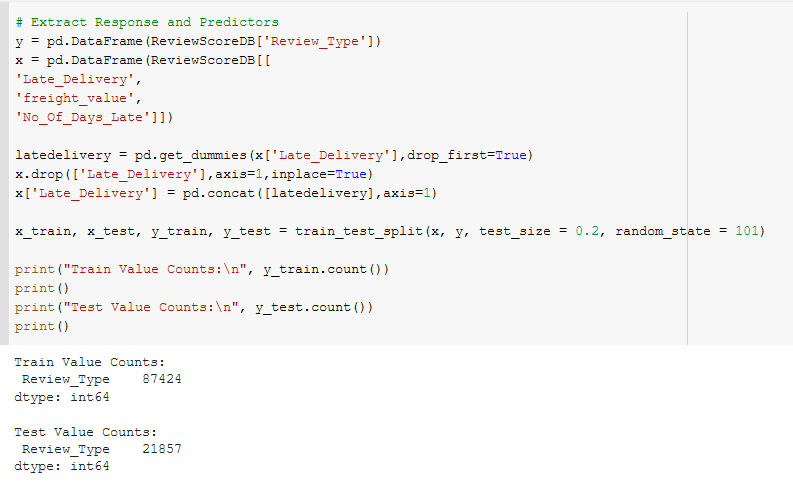
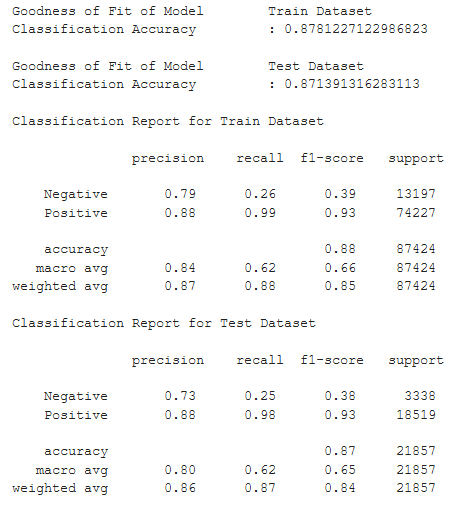
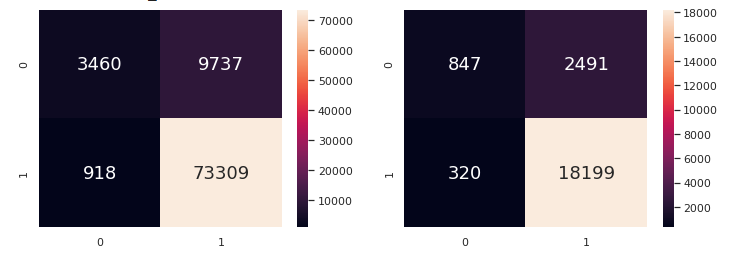
After some deliberation, we have removed Actual Delivery Days as the Number of Days Late is similar to it and is a far better predictor of the Review Type. We now redo the data train/test split with only three predictors. This is to prevent overfitting and to reduce dimensionality of the model. We will now redo the random forest with this new data split. The performance metrics are as follows.
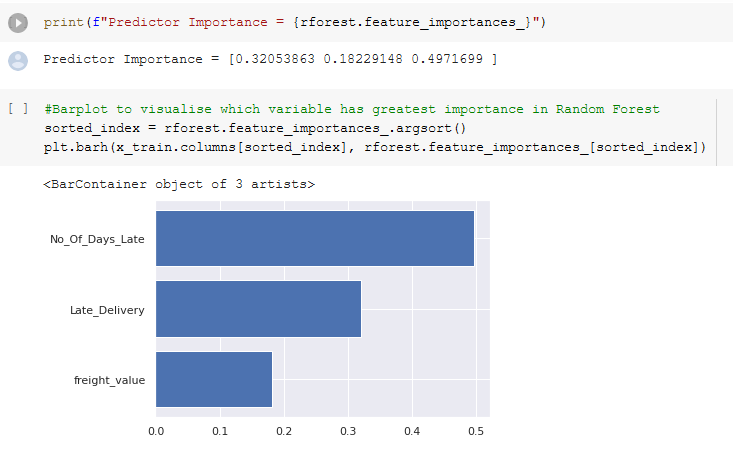
It can be seen that Number of Days Late is the best predictor, followed by whether a delivery came after the expected date and the Freight Value. It can be argued that Late Delivery and Number of Days Late are connected, but we note that customers may fall in the following categories:
1. Delivery on time but customer feels it took too long
2. Delivery late and customer feels it took too long
3. Delivery on time and customer is happy
4. Delivery late but customer is still satisfied
As such, we will consider both predictors to be distinct from each other and will proceed with the machine learning portion of the project.
Logistic Regression
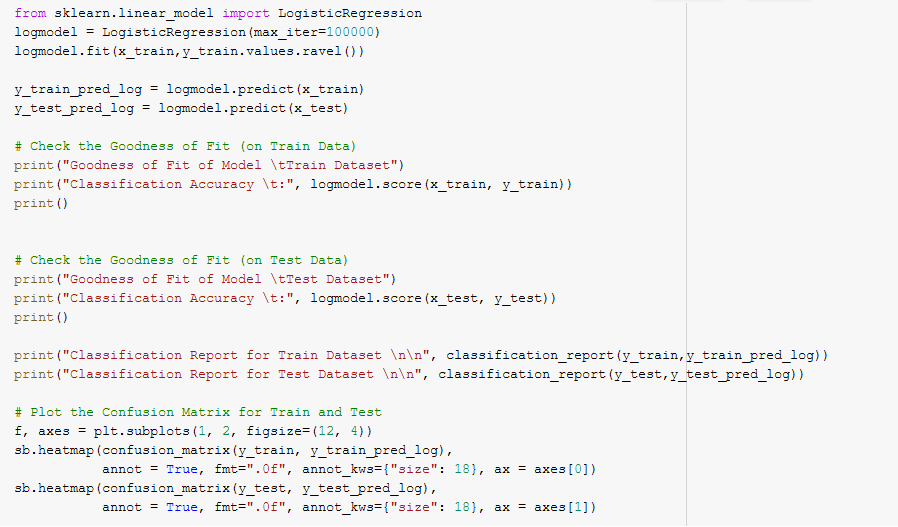
We will now use Logistic Regression to find the extent of each change in variable in predicting the outcome of customer sentiment.
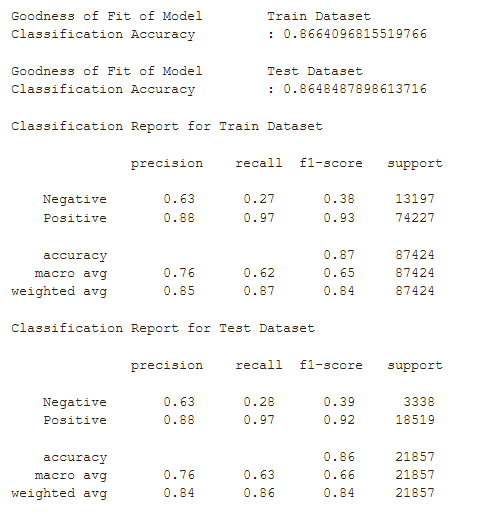
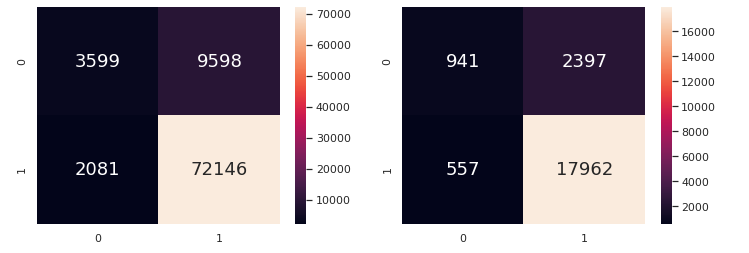
While the accuracy and metrics of Logistic Regression are not as high as Classification, it does give us some insight into the extent of each predictor's influence on customer sentiment.

They are all negatively 'correlated', which makes sense as all three predictors are undesirable to the customer. Customers definitely want less delivery time (especially if they are already late), no late deliveries and cheaper shipping. Interpreting the coefficients, it appears that:
1. Every single day earlier delivery will have a ~2.48% chance of changing the customer's sentiment
2. Freight value has a far lower impact on the customer's sentiment compared to number of days late
We are unable to interpret the coefficient for Late_Delivery as it is a Boolean variable of 1 or 0.
Now that we have a strong understanding of the data, the most impactive predictors and the extent to how they impact the customer sentiment, it is time to build a model that allows us to predict a customer's sentiment based on any given set of predictors. We will first begin with Support Vector Machines.
Support Vector Machine
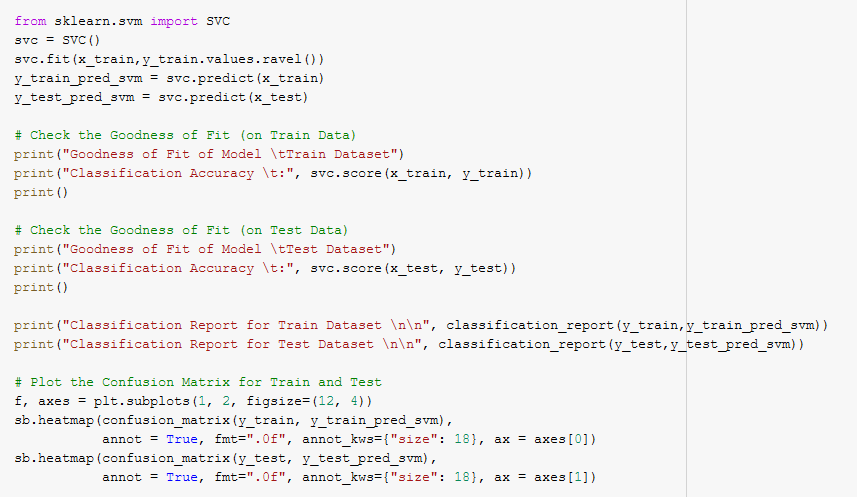
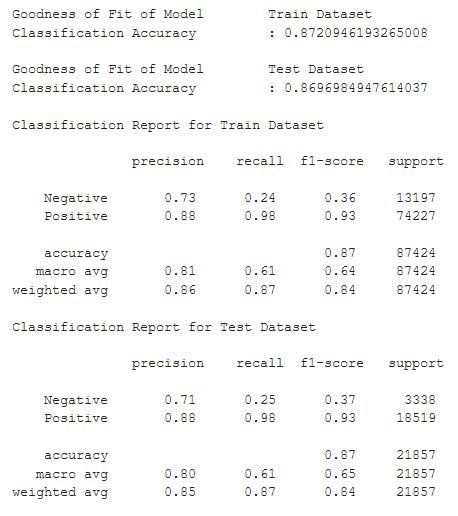

Support Vector Machine was expected to be the best for this Classification problem due to the dimensionality of the data and it being a supervised learning algorithm. However, the performance metrics seem to be similar to that of the machine learning models used previously. Perhaps a clustering algorithm would fare better for our problem. We will move on to K-Nearest Neighbours as our next Machine Learning Algorithm.
K-Nearest Neighbours Clustering
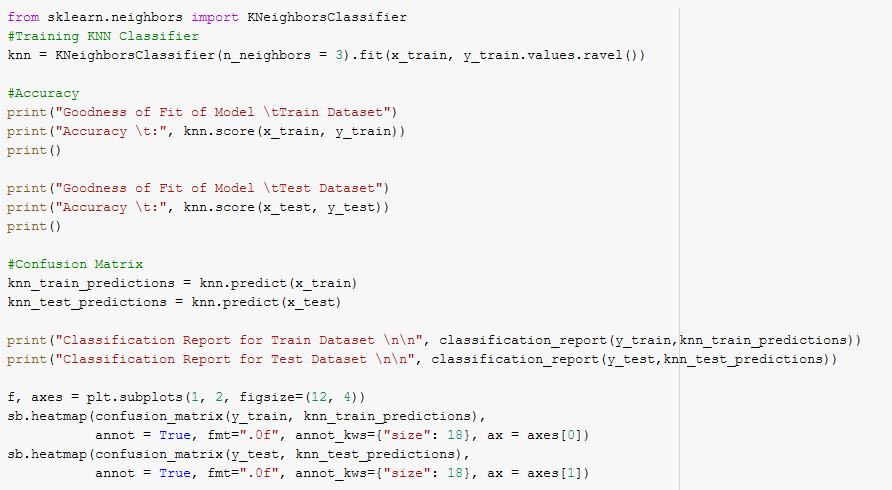
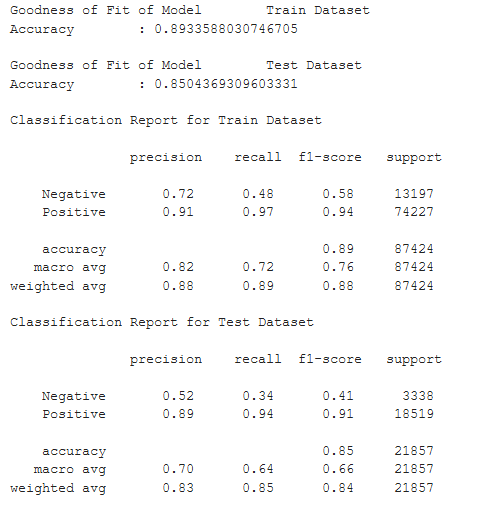
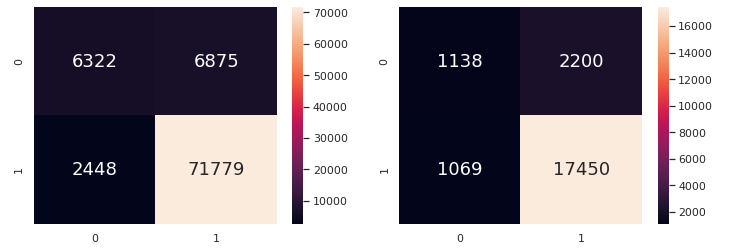
It can be seen that a Clustering approach for the customer sentiment prediction appears to yield a slightly better result than the Classification Algorithms previously used. We are almost done with the Machine Learning part of the project. We will now proceed to finetuning the hyperparameters of the KNN algorithm using GridSearch to maximise the accuracy of the model.
Finetuning Hyperparameters with GridSearch


We will be attempting to maximise the F1 Score and Accuracy of our model by changing several parameters of the KNN Algorithm using GridSearch. The best parameters are as follows.

Fitting the training set into this vastly improved KNN model, we expect this to be our best prediction model yet.
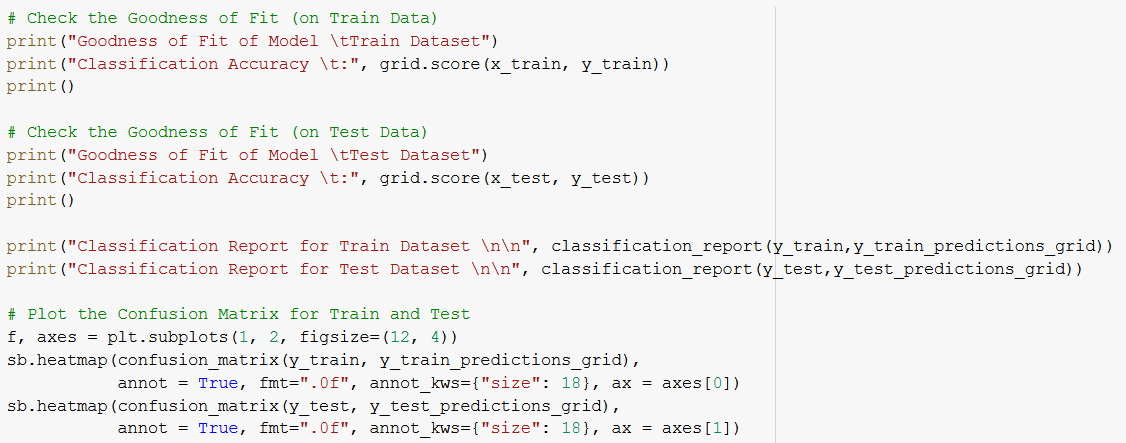
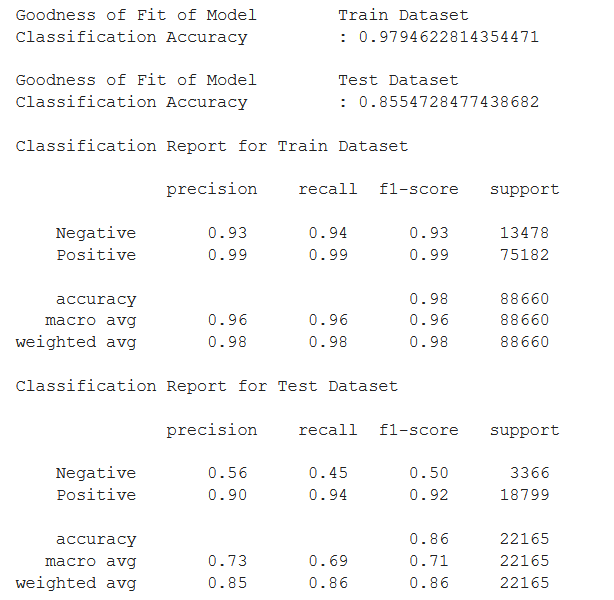
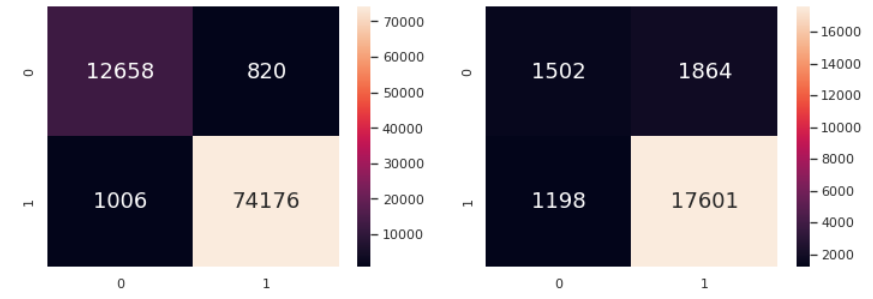
And it follows that we have a ~98% Classification Accuracy (highest yet) and relatively high Weighted Averages for F1. We have found the best model yet to predict Customer Sentiment using 'Actual_Delivery_Days', 'Late_Delivery' and 'Shipping_Fee_Ratio'.
Findings
Recommendations
Back to Projects
